Part 1: History · Chapter 1
From Canaries to Compliance: How Workplace Safety Was Built Before Digital
How workplace safety developed before software: mine canaries, factory inspectors, Heinrich and Bird's triangles, OSHA 1970, the UK HSWA 1974 and the hierarchy of controls.
By LIPAI WANG · Updated · 20 min read · 24 sources · 1 figure
Workplace safety existed long before software. Between the early 1800s and the 1990s, mining, manufacturing and law built the core ideas that safety technology still automates today: early warning of hazards, independent inspection, counting near misses as signs of future harm, legal duties on employers, and a ranked order of controls that puts removing a hazard ahead of protecting people from it. This chapter traces those ideas, explains what held up and what did not, and shows why they matter when you evaluate any modern safety tool.
Why start a technology guide with canaries?
Almost every product discussed later in this book claims to see danger earlier, check conditions more often, or turn small signals into warnings about big events. None of these goals is new. The people who designed mine safety systems, factory inspection regimes and accident statistics were working on the same problems with the tools they had. Knowing how their solutions worked, and where they failed, gives buyers a way to ask sharper questions about software and sensors.
There is a practical reason too. Many of the assumptions built into today's dashboards, such as the belief that reducing minor incidents will reduce fatalities in proportion, come directly from research done in the 1930s and 1960s. Some of that research has aged badly. A safety manager who knows the history can tell when a vendor's pitch rests on a disputed idea.
How did early miners detect invisible hazards?
Coal mining produced the first systematic attempts to detect hazards people could not see or smell. Two gases caused most of the trouble. Firedamp, mostly methane, could explode when it met a naked flame. Afterdamp, the toxic mix left after an explosion or fire, contained carbon monoxide that killed rescuers and survivors.
The Davy lamp
In late 1815, after a series of fatal explosions in the coal fields of northeast England, the chemist Humphry Davy worked out that a flame could not pass through a fine metal gauze, because the wire absorbed and spread the heat. His lamp enclosed the flame in a gauze chimney, so miners could have light without igniting the surrounding gas. A letter describing Davy's findings was read out at a meeting in Newcastle on 3 November 1815, a paper on the lamp was presented to the Royal Society in London on 9 November, and the first trial of the gauze lamp took place at Hebburn Colliery on 9 January 1816 [2].
The safety lamp also became a crude gas detector, because the flame burned higher with a blue tinge when firedamp was present [2]. One device gave both light and a warning. Later chapters show the same pattern with cameras installed for security that are now asked to detect safety risks.
The canary as an early warning system
Carbon monoxide has no color, smell or taste. After investigating mine explosions in the 1890s, the Scottish physiologist John Scott Haldane recommended that rescue teams carry small animals that would show the effects of the gas before people did. Canaries became the standard choice in British mines. When a bird showed distress or fell from its perch, miners knew to withdraw [1].
Britain did not announce the phase-out of canaries until December 1986, when it replaced them with electronic detectors that gave a digital reading [1], less than 40 years before this guide was published.
The canary is the clearest example of a leading indicator: a signal that appears before the harm. It also shows the limits of early warning. A canary only helped if miners carried it into the right place, watched it, and acted when it reacted. The same is true of any modern alert. A detection that nobody sees, or that people learn to ignore, has no safety value.
When did governments start inspecting workplaces?
Detection was one strand. Enforcement was another, and it started in Britain's textile mills.
Britain's factory inspectors
The Factory Act of 1833 is usually treated as the start of state workplace inspection. It appointed four factory inspectors with powers to enter textile mills and question workers, with a focus on the hours and conditions of child workers [3]. The four were responsible for roughly 3,000 textile mills [3], far more than they could cover, but the principle that an independent official could walk into a workplace and check conditions became the foundation of every inspection regime that followed.
Over the next century, Britain added separate laws and inspectorates for mines, quarries, factories, agriculture, explosives and more. The result was protective in places but fragmented, which became a central problem in the 1970s.
Disasters and reform in the United States
In the United States, reform came in waves after disasters. On 6 December 1907, explosions at the Fairmont Coal Company's mines in Monongah, West Virginia, killed 362 miners by the official count, and the real number may have been higher because employment records were incomplete [4]. Monongah was one of the events that led Congress to create the federal Bureau of Mines in 1910, with a mandate to reduce mining deaths [4].
On 25 March 1911, fire swept through the Triangle Shirtwaist Company factory in New York City and killed 146 workers, most of them young immigrant women [5]. Locked and badly designed exits trapped many of the victims. The owners were acquitted of manslaughter, but the fire led to a series of New York laws on fire safety and factory conditions [5].
Two other developments from the same period shaped how safety was paid for and promoted. In 1911 Wisconsin passed the first workers' compensation law in the United States to survive constitutional challenge. It created a no-fault system, so injured workers no longer had to prove employer negligence to receive benefits [6]. Compensation turned injuries into a predictable cost for employers and insurers, which gave both a financial reason to prevent them. Insurers would later fund some of the most influential safety research.
The following year, industry and government representatives met at the first Cooperative Safety Congress in Milwaukee. In 1913 they formed the National Council for Industrial Safety, renamed the National Safety Council a year later [7].
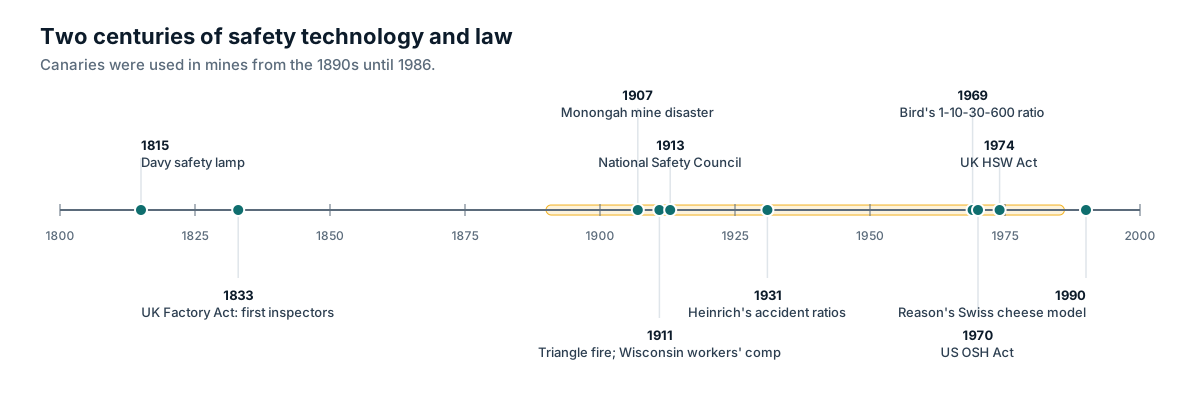
| Year | Event | Why it matters for safety technology |
|---|---|---|
| 1815 | Davy safety lamp | Early hazard control that doubled as a gas indicator |
| 1833 | UK Factory Act appoints four inspectors | Start of independent workplace inspection |
| 1890s to 1986 | Canaries used to detect carbon monoxide | The original early warning sensor |
| 1907 | Monongah mine disaster, 362 deaths | Led toward the US Bureau of Mines (1910) |
| 1911 | Triangle Shirtwaist fire, 146 deaths | Fire safety and factory law reform |
| 1911 | Wisconsin workers' compensation law | Made injuries a measurable cost |
| 1913 | National Safety Council founded | Organized industry safety promotion |
| 1931 | Heinrich's Industrial Accident Prevention | Accident ratios and the "unsafe acts" theory |
| 1969 | Bird's accident ratio study | 1-10-30-600 ratio and near-miss reporting |
| 1970 | US OSH Act signed | OSHA, NIOSH and the general duty clause |
| 1974 | UK Health and Safety at Work etc. Act | Goal-setting law and the HSE |
| 1990 | Reason's Swiss cheese model | Shift from individual blame to system defenses |
What did Heinrich get right and wrong?
Herbert William Heinrich worked as an engineer for an insurance company. In 1931 he published Industrial Accident Prevention: A Scientific Approach, which became one of the most cited books in the history of the profession [8]. Two of its ideas still circulate in training courses, software marketing and boardroom slides.
The 300-29-1 ratio
Heinrich argued that in a group of 330 similar accidents, about 300 would produce no injury, 29 a minor injury and one a major injury [8]. Drawn as a triangle, this suggested that serious injuries sit on top of a large base of minor events and near misses, and that reducing the base would shrink the top.
The core observation, that minor events and near misses vastly outnumber serious injuries, is broadly true and useful. It is the reason organizations collect near-miss reports, and it is the logic behind any technology that promises to surface hazards before someone is hurt.
The 88 percent claim
Heinrich also claimed that 88% of accidents were caused by unsafe acts of people, 10% by unsafe mechanical or physical conditions, and 2% were unpreventable [8]. This idea has done more damage. The safety researcher Fred Manuele, reviewing Heinrich's work in 2011, noted that the study behind the ratios dated from the late 1920s, that its methods were unknown, and that its data came from insurance claim files and plant owners' records, which rarely contain reliable causal information [8]. He concluded that the 88-10-2 ratios could not be supported and that they had directed prevention at the worker instead of the operating system in which the work is done [8].
For technology buyers, the consequence is practical. A tool designed around the belief that most accidents come from careless workers will focus on catching and correcting individuals. A tool designed around the belief that accidents come from the work system will focus on layouts, traffic routes, staffing, equipment and procedures, and will treat worker behavior as a symptom. Both may use the same camera or sensor. The difference is in what the organization does with the data.
What was Frank Bird's 1-10-30-600 ratio?
In 1969 Frank E. Bird Jr., then at the Insurance Company of North America, led a much larger study. His team analyzed 1,753,498 accidents reported by 297 companies in 21 industrial groups, covering about 1.75 million employees and more than 3 billion hours worked [10]. For every reported serious or disabling injury, Bird found about 10 minor injuries, 30 property damage accidents and 600 incidents with no visible injury or damage, which became the widely reproduced 1-10-30-600 ratio [10].
Bird's work broadened the triangle in two ways. It counted property damage, linking safety to loss control and cost. It also made near misses an explicit category to be reported and studied. Bird went on to develop loss causation models and audit systems that shaped management system thinking in later decades [10].
Where the triangle breaks down
The triangle is a statistical picture of many events across many companies. It is not a law that applies to every hazard in every workplace. Research reviewed by the risk engineering community has shown that minor and major accidents often have different causes, so a fall in minor injuries does not guarantee fewer fatalities [9]. The researcher Andrew Hale described the belief that chipping away at minor incidents will necessarily prevent large accidents as a myth [9].
The 23 March 2005 explosion at BP's Texas City refinery, which killed 15 people and injured more than 170 [22], became the standard example. The independent panel led by former US Secretary of State James Baker found that BP's personal injury rates had improved but were not predictive of process safety performance at its US refineries, and that a good personal safety management system did not ensure good process safety [22]. In plain terms, the company was measuring slips, trips and cuts while the conditions for a catastrophic release built up unseen.
Since then, many safety leaders have shifted attention toward serious injury and fatality (SIF) potential: identifying the specific events and precursors that could kill or permanently disable someone, whatever their frequency. Later chapters return to this idea, because it is one of the most useful filters for judging whether a technology's detections are worth acting on.
How did the US OSH Act of 1970 change workplace safety?
By the late 1960s, the patchwork of state laws in the United States was widely seen as inadequate. According to OSHA's own historical account, about 14,000 workers died on the job each year before the federal law, and disabling injuries had increased by 20% during the 1960s [11].
President Richard Nixon signed the Occupational Safety and Health Act, also known as the Williams-Steiger Act, on 29 December 1970 [11]. It created three bodies [11]:
- the Occupational Safety and Health Administration (OSHA) in the Department of Labor, to set and enforce standards;
- the National Institute for Occupational Safety and Health (NIOSH), to carry out research;
- the Occupational Safety and Health Review Commission, to decide contested enforcement cases.
When OSHA opened in April 1971 it covered about 56 million workers at 3.5 million workplaces [11].
Standards plus a general duty
The US model combines specific standards with a catch-all obligation. Standards set detailed rules for hazards such as machine guarding, scaffolding, forklifts and chemical exposure. Where no standard applies, Section 5(a)(1), the general duty clause, requires each employer to provide "employment and a place of employment which are free from recognized hazards" likely to cause death or serious physical harm [13].
The general duty clause also bears on technology. A hazard becomes "recognized" partly through industry knowledge and common practice. As detection technologies become more widely used and understood, the question of what an employer should reasonably have known about a hazard may shift. This is an area to watch rather than a settled point of law.
Recordkeeping and the lagging indicator
The Act also required employers to keep records of work-related injuries and illnesses. Those records created the national injury statistics and the measures, such as the total recordable incident rate, that companies still report to boards and customers. Chapter 2 covers how those paper logs became software.
Results
OSHA reports that worker deaths in the US fell from about 38 a day in 1970 to 15 a day in 2023, and that the rate of injuries and illnesses fell from 10.9 per 100 workers in 1972 to 2.4 per 100 in 2023 [12]. The law was not the only cause. The economy shifted from manufacturing toward services over the same period, and engineering, insurance and management practices improved.
The remaining toll is still large. The Bureau of Labor Statistics recorded 5,070 fatal work injuries in the US in 2024, a rate of 3.3 per 100,000 full-time equivalent workers, or one worker death every 104 minutes [20]. Transportation incidents caused 1,937 of those deaths, and pedestrian incidents rose 19% to 369 [20]. OSHA also notes it has about 1,850 inspectors for roughly 130 million workers, about one compliance officer for every 70,000 workers [12]. Inspection alone cannot see most of what happens at work, which is one reason employers look to their own monitoring.
How did the UK Health and Safety at Work Act 1974 differ?
Britain took a different route. In 1970 the government appointed a committee chaired by Lord Robens to review the whole system. Its 1972 report found the existing mass of laws and separate inspectorates confusing and argued that the main cause of accidents was apathy. The committee recommended a single framework that placed primary responsibility on those who create risks and those who work with them, rather than relying on ever more detailed state rules [14].
The Health and Safety at Work etc. Act 1974 put that philosophy into law [15]. It set broad duties on employers to protect employees and others affected by their work, and it created the Health and Safety Commission and the Health and Safety Executive (HSE), which brought the separate inspectorates under one authority [14].
"So far as is reasonably practicable"
Most of the employer duties in the 1974 Act are qualified by the phrase "so far as is reasonably practicable" [15]. In practice this means an employer must weigh a risk against the time, trouble, cost and physical difficulty of the measures needed to control it, and must take those measures unless the cost is grossly disproportionate to the risk. If prosecuted, the employer carries the burden of showing that it was not reasonably practicable to do more.
The phrase has consequences for technology buyers. As a control becomes cheaper and more widely available, the argument that it was not reasonably practicable becomes harder to make. That logic applied to guards and ventilation in the 1970s. It may apply to proximity warning systems or monitoring tools in the future, depending on how regulators and courts view them. That is a possible direction, and no court has yet settled it.
Results in Great Britain
HSE reported 126 worker deaths in work-related accidents in Great Britain in 2025/26, a rate of 0.37 per 100,000 workers, compared with 495 deaths in 1981 [16]. Falls from height remained the most common cause, at 31 deaths, and agriculture, forestry and fishing had the highest fatal injury rate at 8.09 per 100,000 workers [16]. Workers aged 60 and over made up about a third of the deaths [16].
| Feature | US OSH Act 1970 | UK HSWA 1974 |
|---|---|---|
| Core approach | Specific standards plus a general duty clause | Broad goal-setting duties plus regulations and guidance |
| Key qualifier | Recognized hazards likely to cause death or serious harm | So far as is reasonably practicable |
| Regulator | OSHA (enforcement), NIOSH (research) | HSE (with local authorities for some sectors) |
| Worker coverage at start | About 56 million workers (1971) | All work activities, including self-employed in many cases |
| Recent fatal rate | 3.3 per 100,000 FTE (2024) | 0.37 per 100,000 workers (2025/26) |
The two fatality rates are not directly comparable. The US figure includes road transport deaths of workers, which make up a large share of the total, while the British figure excludes most work-related road deaths, which fall under road traffic law. Read the table as a description of how each system measures itself, and avoid ranking the two countries on it.
Why did the focus move from people to systems?
From the 1970s onward, a series of major disasters changed how safety specialists thought about cause. The 1984 chemical release at Bhopal in India, the 1986 Chernobyl reactor accident in Soviet Ukraine and the 1988 Piper Alpha fire in the North Sea could not be explained by one careless person. Chernobyl, on 26 April 1986, combined a flawed reactor design with operators who broke the rules and switched off important safety systems, in an industry that lacked any real safety culture [24].
Piper Alpha and the safety case
On 6 July 1988, a gas condensate leak on the Piper Alpha platform ignited and led to explosions and fires that killed 167 people [19]. Lord Cullen's public inquiry made 106 recommendations, all accepted, and led to a goal-setting safety regime offshore [19]. The best known was the safety case: operators must now prepare a document showing that they have the ability and means to control major accident risks effectively, and have it accepted by HSE [23].
The Swiss cheese model
In 1990 the psychologist James Reason published Human Error, which introduced what became known as the Swiss cheese model [18]. Reason described an organization's defenses as slices of cheese, each with holes. An accident happens when holes in several layers line up. Some holes are active failures, such as a mistake by an operator. Others are latent conditions, such as poor design, inadequate staffing, weak supervision or conflicting goals, which may sit unnoticed for years [18].
The model shifted investigations away from finding the person who made the last mistake and toward finding the weaknesses that allowed the mistake to cause harm. It also gave a useful way to think about technology. A monitoring system is one more slice. It can catch some failures, but it has holes of its own: blind spots, false negatives, alerts that go unanswered. It does not make the other layers unnecessary.
What is the hierarchy of controls?
The hierarchy of controls is the single most useful idea in this chapter for evaluating safety technology. NIOSH, which promotes it in the US, lists five levels in order of general effectiveness [17]:
- Elimination: remove the hazard entirely, for example by changing a process so a toxic chemical or a manual lift is no longer needed.
- Substitution: replace the hazard with something less dangerous.
- Engineering controls: isolate people from the hazard through design, guards, barriers or ventilation.
- Administrative controls: change the way people work, through procedures, training, rotation, signs and supervision.
- Personal protective equipment (PPE): equipment worn by the worker, such as gloves, hard hats and respirators.
NIOSH explains that the upper levels are more effective because they control exposure without depending on human behavior, while administrative controls and PPE require significant and ongoing effort by workers and supervisors to work [17]. The UK, the EU and ISO 45001 use very similar hierarchies, sometimes with different wording.
Where does monitoring technology sit?
Most digital safety tools fit into the administrative layer. A camera that detects a missing hard hat is checking compliance with a PPE rule. An alert when a pedestrian enters a forklift zone is enforcing a traffic management procedure. A dashboard of near-miss trends informs supervisors and managers. None of these remove the hazard.
They still have a place. Administrative controls are often the only practical option for some risks, and checking whether controls are working is a core part of any management system. Technology can also support higher levels: data from a monitoring system can show that a layout should be redesigned, which is an engineering change, or that a task should be eliminated altogether. Some systems can act directly on machines, for example by slowing a vehicle near a person, which moves them closer to an engineering control.
A good test for any vendor pitch is to ask: which level of the hierarchy does this product operate at, and what will we do with its output to move risk control further up?
| Hierarchy level | Traditional example | Example of how technology can support it |
|---|---|---|
| Elimination | Redesign a process to remove work at height | Data that shows a task is high risk and worth redesigning |
| Substitution | Use a less toxic chemical | Chemical inventory software that flags hazardous substances |
| Engineering | Physical barriers between people and vehicles | Interlocks or speed limiters triggered by detection systems |
| Administrative | Traffic plans, permits, training, supervision | Automated alerts, digital permits, behavior and zone monitoring |
| PPE | Hard hats, hi-vis, respirators | Detection of PPE non-compliance; connected PPE |
How big is the problem worldwide?
National statistics only capture part of the picture. The International Labour Organization estimates that in 2019 about 2.93 million workers died from work-related causes worldwide, an increase of more than 12% compared with 2000 [21]. Most of those deaths, about 2.6 million, came from work-related diseases, with about 330,000 from fatal occupational accidents [21]. The ILO also estimated that around 395 million workers suffered non-fatal work injuries in 2019 [21].
Two points follow for technology. First, the burden of occupational disease, from dust, chemicals, long hours and other exposures, is far larger than the burden of acute injury, yet most visible safety technology focuses on injuries because they are easier to see. Second, most of the global toll falls in places where large monitoring systems are rare. The ILO reports that Asia and the Pacific account for almost 63% of work-related deaths [21].
Which old ideas does today's technology inherit?
The table below maps the historical ideas in this chapter to the technologies covered in Parts 2 and 3. It is a useful checklist when you meet a new product category.
| Historical idea | Origin | Modern equivalent | Question to ask |
|---|---|---|---|
| Early warning sensor | Canary, safety lamp | Gas monitors, wearables, AI video alerts | How early is the warning, and who acts on it? |
| Independent inspection | 1833 factory inspectors | Audits, inspection apps, continuous video checks | What is inspected, how often, and by whom? |
| Counting precursors | Heinrich 1931, Bird 1969 | Near-miss reporting, automated event detection | Do the precursors predict serious harm, or only minor injury? |
| Blame the worker | Heinrich's 88% | Behavior-focused monitoring | Does the system lead to coaching and redesign, or only discipline? |
| System defenses | Reason 1990 | Multi-layer controls, analytics on root causes | Which latent conditions will the data reveal? |
| Reasonably practicable | HSWA 1974 | Cost-benefit of new controls | Is this control now cheap enough to be expected? |
| Hierarchy of controls | NIOSH and others | Framing of all technology | Which level does the tool operate at? |
What should buyers take from this history?
Three lessons carry through the rest of this guide.
The first is that detection only works when it leads to action. The canary helped because miners left the mine when it reacted. A modern alert helps only if the organization has a clear response, someone with time to make it, and a culture where acting on a warning is expected rather than resented.
The second is that what you count shapes what you manage. Heinrich's ratios and Bird's triangle encouraged organizations to count minor events. The Texas City investigation showed the cost of counting the wrong things. Any new data stream should be judged on whether it measures exposure to serious harm, not just volume of events.
The third is that law and practice tend to raise the bar as controls get cheaper. The reasonably practicable test in Great Britain and the recognized hazard test in the US both depend on what a responsible employer would know and do. New technology can change those expectations over time, which creates both an opportunity and an obligation for employers who adopt it.
Summary
Workplace safety before digital technology was built from a few durable ideas. Miners used the Davy lamp from 1815 and canaries until 1986 as early warning devices. Britain's 1833 Factory Act created independent inspection. In the United States, disasters such as Monongah in 1907 and the Triangle Shirtwaist fire in 1911 drove reforms, and Wisconsin's 1911 compensation law turned injuries into a cost employers and insurers wanted to reduce.
Insurance-funded research produced Heinrich's 300-29-1 triangle in 1931 and Bird's 1-10-30-600 ratio in 1969. Both made near misses a central concern, but Heinrich's claim that 88% of accidents come from unsafe acts has been strongly criticized, and the BP Texas City investigation showed that personal injury rates do not predict catastrophic process failures.
The US OSH Act of 1970 created OSHA and NIOSH, combining standards with a general duty clause, and US worker deaths fell from about 38 a day in 1970 to 15 a day in 2023. The UK Health and Safety at Work etc. Act 1974 set goal-setting duties qualified by "so far as is reasonably practicable" and created the HSE; Great Britain recorded 126 worker deaths in 2025/26. Piper Alpha and Reason's Swiss cheese model moved attention from individual blame to system defenses.
The hierarchy of controls ranks elimination, substitution and engineering above administrative controls and PPE. Most monitoring technology sits in the administrative layer. Its value depends on whether the organization uses its output to act quickly on warnings and to move risk control higher up the hierarchy.
Frequently asked questions
+Why do safety professionals still talk about the canary in the coal mine?
Because it was an early warning system that worked before people were harmed. Canaries reacted to carbon monoxide faster than miners, giving time to escape. British mines replaced them with electronic detectors in 1986, and the same principle of sensing a hazard before injury underlies modern gas monitors and many digital safety tools.
+Is the Heinrich safety triangle still valid?
As a rough picture that minor events outnumber serious ones, yes. As a law that cutting minor incidents will proportionally cut fatalities, no. Investigations such as those into BP Texas City in 2005 showed that serious accidents often have different causes from minor ones, so serious-injury precursors need their own attention.
+What is the difference between the US and UK approach to safety law?
The US OSH Act combines detailed standards with a general duty clause requiring workplaces free from recognized serious hazards. The UK Health and Safety at Work etc. Act 1974 sets broad duties that employers must meet so far as is reasonably practicable, weighing risk against the cost and effort of controls, backed by regulations and guidance.
+Where does new safety technology fit in the hierarchy of controls?
Most monitoring technology, including cameras, wearables and analytics, supports administrative controls because it changes how people work or how supervisors respond. It can also help verify engineering controls. It does not remove the hazard, so it should complement elimination and engineering, not replace them.
Related reading
Sources
- [1]What Happened to the Canary in the Coal Mine? (Smithsonian Magazine)
- [2]Davy lamp (Wikipedia)
- [3]Timeline (History of Occupational Safety and Health)
- [4]Monongah mining disaster (Wikipedia)
- [5]Triangle Shirtwaist Factory Fire: Topics in Chronicling America (Library of Congress)
- [6]The 1911 Workman's Compensation Act and the Birth of the Wisconsin Idea (University of Wisconsin)
- [7]History (National Safety Council)
- [8]Reviewing Heinrich: Dislodging Two Myths From the Practice of Safety (Manuele, Professional Safety, 2011)
- [9]The Heinrich/Bird safety pyramid (Risk Engineering)
- [10]A Tribute to Frank E. Bird Jr. (DNV)
- [11]OSHA's 30th Anniversary (OSHA)
- [12]Commonly Used Statistics (OSHA)
- [13]OSH Act of 1970, Section 5: Duties (OSHA)
- [14]Accidents and Apathy: The Construction of the 'Robens Philosophy' of Occupational Safety and Health Regulation in Britain, 1961-1974 (PMC)
- [15]Health and Safety at Work etc. Act 1974 (legislation.gov.uk)
- [16]Latest annual work-related fatalities published (HSE, July 2026)
- [17]Hierarchy of Controls (NIOSH)
- [18]Revisiting the Swiss Cheese Model of Accidents (Eurocontrol)
- [19]Cullen Report (IChemE Safety Centre)
- [20]Census of Fatal Occupational Injuries Summary, 2024 (BLS)
- [21]A call for safer and healthier working environments (ILO, 2023)
- [22]The BP U.S. Refineries Independent Safety Review Panel report (Baker Panel, 2007)
- [23]Offshore health and safety law (HSE)
- [24]Chernobyl Accident 1986 (World Nuclear Association)
New chapters and updates, once a month
One email when we publish or update guidance. No vendor promotions. Unsubscribe any time.